I. Introduction
“Make things as simple as possible, but not simpler”
Albert Einstein
This saying from the famous theoretical physicist is one of my favorites. This
application can be applied to trading as well. Trading can be quite simple, but in an
effort to filter trade signals, we sometimes add an extra dimension with an additional
indicator or set of rules. This doesn’t automatically make a trading system complicated,
but there are limits to its simplicity.
This system is one such system.
There are 2 sets of indicators and no more. One indicator filters out the other and the
average creates ideal trading opportunities. It’s not as simple as a single indicator, but
at the same time, is definitely not complicated.
I have been trading for a long time now, since 2000. I have seen a lot of trading
systems, talked to a lot of professional traders, seen a lot of success stories and
unfortunate failures. I have learned a lot and have been able to apply what I have
learned.
This trading system was something I developed a while ago and has been used by a
handful of professional traders with incredible success.
Why has it not been released for public use until now? The truth is that this system has
an element of simple efficiency that seems to be looked down upon by the average day
trader. They have it in their mind that if it works, it has to be complicated. This trading
system is indeed simple in its application, but not so simple that it doesn’t work properly.
I want you to make money trading; I want you to succeed as a trader. This is why I am
willing to give away such a powerful trading system instead of selling it. I invite you to
use this system, apply it in your daily trading and become profitable.
Best of luck!
www.GlobleFX.com
Without getting into the ins and outs of Forex, I am going to assume that at this point,
you know what you need to know about trading to apply this system. The indicators are
found on every charting platform, they are very common.
I use the MetaTrader4 platform as my charting package. You can find them for free
almost everywhere. If you want a copy of these amazing free charts, you can do so by
visiting this website:
http://www.metatrader4.com
Click the “Free download” button and go from there.
II. Indicators
You will need only 3 indicators:
For the entries:
20 Exponential Moving Average – applied to the high (dodger blue)
20 Exponential Moving Average – applied to the low (red)
For the trailing stop:
10 Exponential Moving Average – applied to the high (red)
10 Exponential Moving Average – applied to the low (dodger blue)
Additional entry indicator:
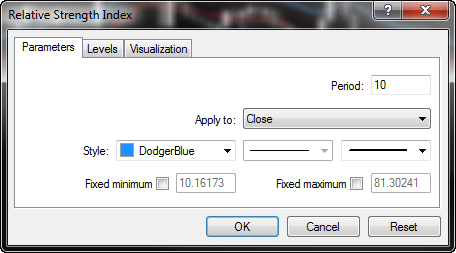
Relative Strength Index – period 10 – levels at 45 and 55 (dodger blue)
10 Simple Moving Average applied to RSI (red)
A. 20 EMA of the Highs and Lows
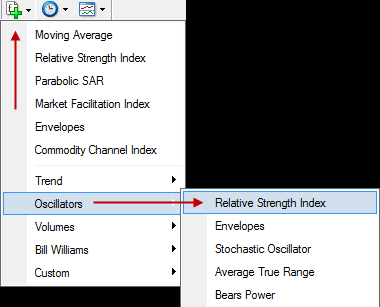
First, we add the 20EMA of the highs. You will find Moving Averages in your indicators
files by clicking on the Indicators button in the toolbar,

Next, place your mouse over “Trend” and then click “Moving Average” from the new
popup menu.
In my example below, the Moving average selection is at the top because I have
recently used it, this might not be the case for you.
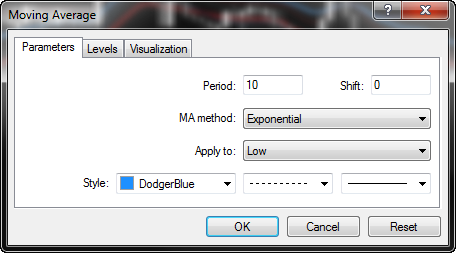
When you select the Moving Average indicator, the Moving Average properties box will
pop up. Firstly, make sure the Parameters tab is chosen and then you need to fill it out
so it looks like the one below. Once you have the fields properly filled out, click “OK”.
Of course, you can make the color and the line thickness anything you like, but the
values should be the same:
Period: 20
Shift: 0
MA method: Exponential
Apply to: High
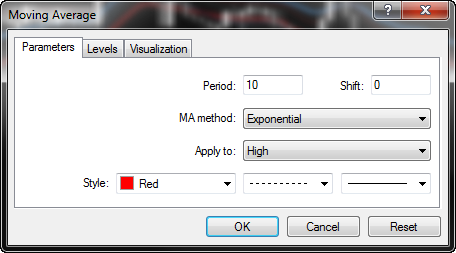
Next, we add the 20 EMA of the lows.
Following the same steps as above, we apply a new moving average but this time,
when the properties box pops up, we choose to apply to the lows. I also make this EMA
a different color. Once you have the field properly filled out, click OK.
Period: 20
Shift: 0
MA method: Exponential
Apply to: Low
B. 10 EMA of the Highs and Lows
Just like how we added the 20 EMAs, we now add the 10 EMAs in exactly the same
way.
You will notice that for the 10 EMAs, the line colors have been reversed from the 20
EMAs. The 10 EMA high is colored red and the 10 EMA low is colored blue.
You will also notice that I have chosen the thinnest line and then chosen to make it a
dotted line rather than a solid line. This will help us make the distinction between the
lines on the chart.
10 EMA of the High
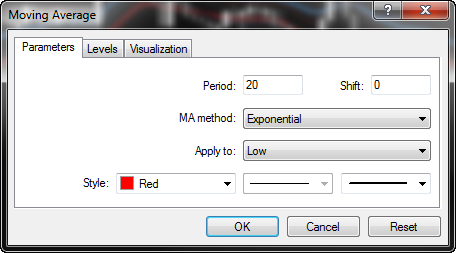
10 EMA of the Low
C. RSI
To add the Relative Strength Index, click the indicators button in the toolbar.

Next, place your mouse over Oscillators and then click Relative Strength Index from the
new popup menu.
In my example below, the Relative Strength Index selection is at the top because I have
recently used it, this might not be the case for you.

Next, place your mouse over Oscillators and then click Relative Strength Index from the
new popup menu.
In my example below, the Relative Strength Index selection is at the top because I have
recently used it, this might not be the case for you.

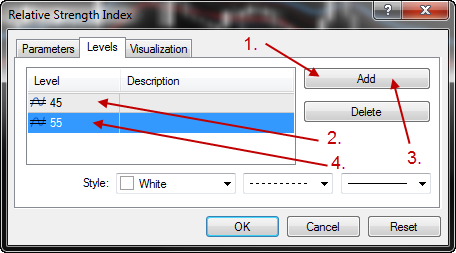
Next, we add the 45 and 55 levels to the RSI.
Click the “Levels” tab, then you need to add a 45 level and a 55 level to your Relative
Strength Index.
Again, you can make the color and the line thickness anything you like.
1. Click the “Add” button and you will see a level appear in the level window.
2. Make the level 45.
3. Click the Add button again (you might have to click it twice to get a new level in
the window).
4. Make this level “55”
Change the color and line thickness to what you like. I am using this on a black chart, so
I made this level line white and I made the line a dotted line. Click “OK”.
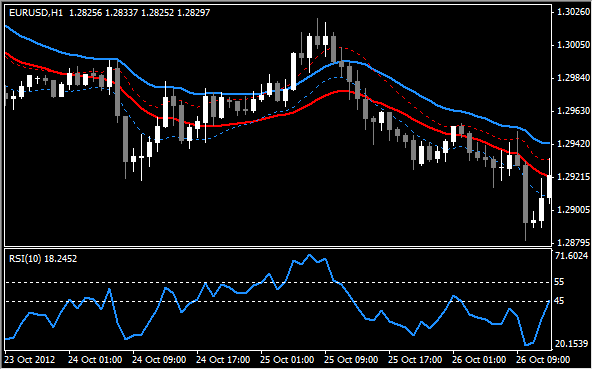
You now have MOST of the indicators with the proper settings on your chart. We still
have to add the 10 SMA to the RSI.
My chart is a copy of the Rapid Result Method basic chart, so it is a black chart with
white bull candles and grey bear candles.
After adding the Forex Power Pro indicators, your chart will look something like this:
The next step now is to add the 10 SMA to the RSI.
1. Click the Navigator button on your toolbar.
2. Double-click the Indicators folder to open it.

3. Once the Indicators folder is opened, scroll down until you see “Moving Average”.
Drag and drop that onto the RSI indicator window.

4. The Moving Average properties box will open. Make the settings:
Period: 10
Shift: 0
MA method: Simple
Apply to: Previous Indicator’s Data

Note:
The “Apply to” setting is very important. If it’s not set to “Previous Indicator’s Data”, you
will not get the moving average to appear on the RSI. It will instead appear on the price chart.
Once everything is filled out, click “OK”.
Your finished chart will now look like this:

This system looks pretty simple. It is pretty simple
It works really well!
Just by looking at the chart, you can already see that it works, even without knowing
exactly what to do.
Let’s get ready to bank some pips!
Before we get to the rules of the system, let me first briefly explain what the different
indicators are for.
20 EMAs of the highs and lows.
These EMAs are used to find entry signals and to help us place an initial stop loss.
A close above the blue 20 EMA of the highs means we can place a buy trade. Our initial
stop loss will go just under the red 20 EMA of the lows.
A close below the red 20 EMA of the lows means we can place a sell trade. Our initial
stop loss will go just over the blue 20 EMA of the highs.
10 EMAs of the highs and lows
These are used for our trailing stop. Once the market starts to move in our favour, we
will use the 10 EMAs as a guide for moving our stop loss. The 10 EMAs are colored
according to the 20 EMAs.
In a buy trade, we will use our blue 10 EMA of the lows to trail our stop loss. As price
climbs, the 10 EMA of the lows will also climb. Each new closed candle will see us
moving our stop to just under the 10 EMA of the lows.
In a sell trade, we will use our red 10 EMA of the highs to trail our stop loss. As price
drops, the 10 EMA of the highs will also drop. Each new closed candle will see us
moving our stop to just over the 10 EMA of the highs.
RSI and the 10 SMA
The RSI is a confirmation of an entry signal. We could literally trade using the RSI/10
SMA combination without ever looking at the price chart.
In a buy trade, we want to see the RSI move over the 55 line and at the same time be
over the 10 SMA.
In a sell trade, we want to see the RSI move under the 45 line and at the same time be
under the 10 SMA.
Time for the rules.
III. Rules
A. ENTRY Rules
1. Buy Trade
1. Price closes above the blue 20 EMA of the highs.
2. RSI is above the 55 line.
3. RSI is above the 10 SMA on the RSI indicator.

When all the elements fall together, we are good to enter the market in a buy trade.
2. Sell Trade
1. Price closes below the red 20 EMA of the lows.
2. RSI is below the 45 line.
3. RSI is below the 10 SMA on the RSI indicator.

When all the elements fall together, we are good to enter the market in a sell trade.
B. STOP LOSS Rules
1. Buy Trade
Initial Stop Loss
As we enter a buy trade, the initial stop loss will be placed a few pips under the red 20
EMA of the lows. (The term “a few pips” will range from timeframe to timeframe.)

Trailing Stop Loss
As new candles form and close, the stop loss will get moved along the blue 10 EMA of
the lows (dotted line). This will reduce your risk almost immediately. This aspect is very
important in any trading system.

When a candle closes, the 10 EMA of the lows will climb. This new position under the
last closed candle is where we move our Stop Loss to.
2. Sell Trade
Initial Stop Loss
As we enter a sell trade, the stop loss will be placed a few pips over the blue 20 EMA of
the highs. (The term “a few pips” will range from timeframe to timeframe.)

Trailing Stop Loss
As new candles form and close, the stop loss will get moved along the red 10 EMA of
the highs (dotted line). This will reduce your risk almost immediately, this aspect is very
important in any trading system.

When a candle closes, the 10 EMA of the highs will fall. This new position over the last
closed candle is where we move our stop loss to.
C. TAKE PROFIT Rules
1. Buy Trade
When we find a trade setup, how much do we go for?
My general rule of thumb is a 1 to 1 risk to reward ratio.
As you can see by scrolling back through time on your charts, a “2 to 1” risk reward will
work out very often.
To begin with though, the 1:1 is the safest bet. It will get you a ton of winners and
reduce your losers.
So, what is a 1:1 risk reward ratio?
Whatever we set our stop loss to is what we go for as a profit target. For example, if our
stop loss is 25 pips from where we enter the market, we will aim for a 25 pip profit
target.

It’s really that easy
2. Sell Trade
Following the 1 to 1 risk reward ratio, again we first look to the stop loss we have in
mind. In the example below, the stop loss is 40 pips away from the entry. This is called
the “Initial Stop Loss” as it’s the initial one we place when we place the trade. It will be
the farthest away we will get with our stop.

As the market moves in our favor, the stop loss will move closer to the entry level as the
10 EMA moves closer to the entry level. We do NOT change our take profit level to
reflect the new Stop loss level. It will remain at the distance the Initial Stop Loss was
placed.
IV. Trade Examples
A. Complete Buy Trade

1. A candle closes above the 20 EMA of the highs.
2. The RSI moves above the 55 level
3. The RSI is above the 10 SMA of the RSI.
4. The stop loss goes below the 20 EMA of the lows of the candle that signalled the
entry. There’s no need to look for swing lows, only the closed candle that triggered the
entry. The Stop Loss is 35 pips on this trade.
5. The take profit will be 35 pips. Using the 1 to 1 (1:1) risk to reward ratio, if the stop is
65 pips, the take profit will also be 65 pips.
6. As the price moves in our favor, the stop loss will follow along the 10 EMA of the
lows, reducing our risk and potential loss if we do lose this trade.
B. Complete Sell Trade

1. A candle closes below the 20 EMA of the lows.
2. The RSI moves below the 45 level
3. The RSI is below the 10 SMA of the RSI.
4. The stop loss goes above the 20 EMA of the highs of the candle that signalled the
entry. You don’t need to look for swing highs, only the closed candle that triggered the
entry. The Stop Loss is 65 pips on this trade.
5. The take profit will be 65 pips. Using the 1 to 1 (1:1) risk to reward ratio, if the stop is
65 pips, the take profit will also be 65 pips.
6. As the price moves in our favour, the stop loss will follow along the 10 EMA of the
highs, reducing our risk and potential loss if we do lose this trade.
V. 2 to 1 Profit Target Option
You will find that a lot of your trades manage to hit twice what you are risking on it. This
means that if you place a 50 pip stop loss, you can hit a 100 pip profit target.
This type of trade is one that can really skyrocket your profits and the benefit of this kind
of target is that you only have to win 1 trade and lose 2 just to break even. That’s a 33%
win ratio in order to not make any money and not lose any money. With the proper trade
management, you should never get anywhere near as low as that; you will be doing
much better.
I mentioned trade management. If you are aiming for a 2:1 risk reward ratio, the best
thing that you can do is manage the trade with your 10 EMA, but also it’s important to
move your stop loss to break even when you reach the 1:1 level. If you have a stop loss
of 25 pips and you are aiming for 50 pips, move your stop to break even when the
market hits 25 pips in profit.

VI. RSI Neutral Zone
You’ve noticed that there are 2 levels on the RSI. If you are familiar with the RSI at all,
you will generally see only 1 line at the 50 level.
The RSI 50 line is like a busy intersection, and taking trades based on this can be
extremely dangerous. The market at this level can be very undecided and choppy. The
whole system has been built around the momentum the market has once it’s made up
its mind in a certain direction.
The space in between the 45 and 55 levels is a kind of a Neutral Zone. Once price has
entered this zone, it doesn’t mean that price will move through it. It’s a “pit-stop” where
the market can regroup.

Once price has entered the Neutral Zone, it can pop out in either direction. In a trend, it
will pop out in the original direction… in a counter-trend, it will move right through.
Once the RSI is in the Neutral Zone, we can expect a new trade to happen and it could
happen in either direction. Once we get a new trade, all the same rules apply, whether
or not the trade is in the same direction as the previous one.
Here is an example of both trend and counter trend trades, after the RSI enters the
Neutral Zone. Both yield successful trades.

VII. RSI as an Exit
This is to be used only after the market has started to move in your direction… using it
too early could get you out of a trade before it even gets going.
Once the trade has started moving and the price has pulled away from the 20 EMAs,
you can hold onto the trade until the RSI crosses over the 10 SMA on the opposite
direction. This quite often can get you out of a trade at almost the best possible time.

This works best when both the RSI and its 10 SMA have moved outside of the Neutral
Zone and price is moving nicely.
Note:
I still prefer the 1:1 exit, but for traders who want to hang onto their trades longer, this
could be an excellent way to get a lot out of the potential generous market moves.
VIII. Money Management
This is an important aspect to touch on.
When placing a trade, you never want to put so much at risk that you could potentially
deplete your account in a very short time. You want to be here, for not just a long time,
but for as long as you want to be here.
I will tell you what I do as far as money management goes.
I never risk more than 2% on any given trade. As for beginners, I strongly suggest that
they risk no more than 1%. This means that if your initial stop loss gets hit, you don’t
lose more than 1% of your total account balance.
Next is the total number of open trades that are subject to possible losses. If you are
risking 2% on 3 open trades, your “exposure” is 6%. I will limit my exposure to 6%, but I
prefer 5%.
This system is a profitable system, and the trade management will mean that your
losses are usually smaller than your wins. If you manage your money properly, you will
be trading the FX markets for years to come.
Forex trading has acquired a name for quick profits, and you can indeed make money
quickly trading Forex. Shady Forex marketers will have you believe that you can
become a millionaire in a few short weeks, maybe a couple of months. This simply isn’t
the case, and trying to do so can lead to disaster.
Learn control and manage your money. You won’t win every trade (you CAN’T win
every trade) and there will even be times when you have a string of losses. These times
are survivable with the right money management.
The good news is that you can absolutely grow your trading account to something that
most people would envy, but it will happen over time and with strict trade and money
management.
IX. Conclusion
I know that you have received this trading system free of charge.
I also know that most traders will not take the time to test and properly respect a free
trading system.
What I want is for you to succeed.
I have done very well as a Forex trader and as an educator. This trading system is free
because it’s one way that I can help my fellow traders achieve the heights I have been
able to reach.
I sincerely hope that you will treat this system as a trading system that can help you get
to your dreams and accomplish your goals as a trader.
This system is one of my own, it’s been around for a while and it’s been used by some
of the best traders I know. It works, simple as that!
Please enjoy this system and let it help you achieve your goals!
Thank you very much for your time and your consideration. Best of luck to you in your
trading and in your life as a whole!

